
AI is supposed to be reshaping commercial real estate. Every investment committee is asking the same question: how does the AI buildout change industrial demand? We decided to look at the data rather than theorize about it.
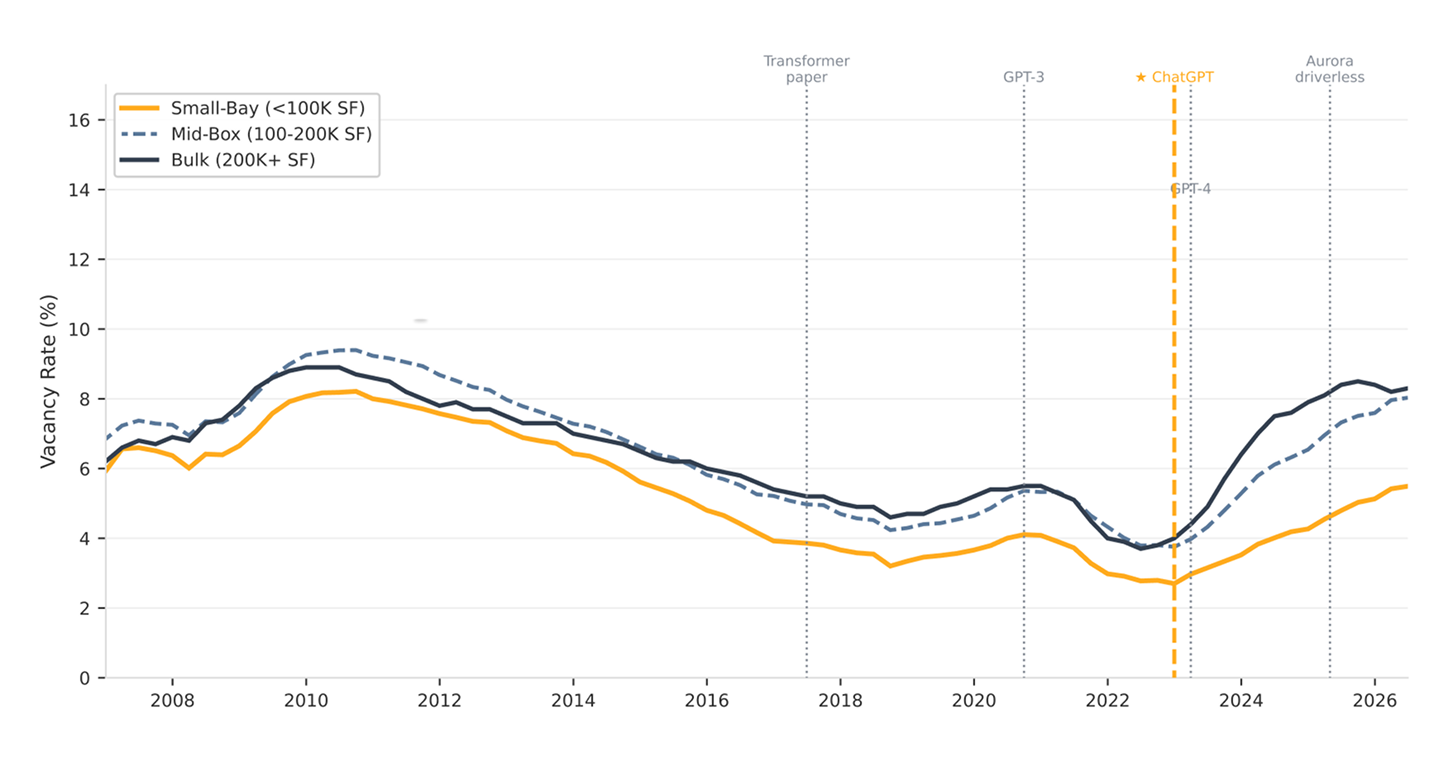
Source: CoStar Analytics; Faropoint Research, 2026
The chart above shows US industrial vacancy rates for three building-size cohorts from 2007 through mid-2026, with major AI milestones marked. ChatGPT launched in November 2022. GPT-4 followed in March 2023. The AI infrastructure capex boom accelerated through 2024. Find those moments on the chart and look for a corresponding break in vacancy. There isn't one.
What you do find: the vacancy divergence between bulk and small-bay industrial began in early 2023 and has widened steadily since. Its cause is not artificial intelligence. It is a supply wave that was already baked in before any enterprise customer had a ChatGPT subscription. Annual construction starts for industrial space peaked at nearly 500 million square feet in 2022. Those buildings began delivering in 2023 and have continued through 2025. The market has been absorbing a glut that was ordered in 2021 - the real-estate equivalent of the semiconductor cycle.
EastGroup Properties put it plainly on their Q1 2026 earnings call: "Vacancy out there in industrial is in the bigger box on the edge of town, not the infill shallow bay." The pain is real and concentrated - in 100,000-500,000 SF mid-box buildings that benefited most from the pandemic logistics surge and are now working off that excess. Small-bay vacancy, the sub-100,000 SF infill universe, has stayed in the 3-5% range throughout the same period.
To move beyond the visual evidence, we built a two-way fixed-effects panel spanning 46 markets and 40 quarters (2016 Q1-2025 Q4, N = 1,840 market-quarters). We then ran a difference-in-differences test around the ChatGPT launch date, using 2018 AI employment share as a proxy for market-level AI exposure intensity. The AI intensity coefficient is statistically indistinguishable from zero across every specification. The GDP coefficient tells a different story: β = -0.106 (t = -4.0, p < 0.001). Every percentage point of annual real GDP growth in a metro is associated with approximately 10 basis points of small-bay vacancy tightening. Vacancy responds to the economy, not to what Anthropic or OpenAI announces.
Operating data from the publicly traded REITs corroborates the same split. Rexford Industrial, Terreno Realty, and EastGroup Properties - the three large infill-focused platforms - have maintained occupancy above 96% and continued pushing rents in their core markets through 2025. STAG Industrial and LXP Industrial, with heavier exposure to mid-box and bulk product, have reported wider vacancy and softer rent growth in overlapping periods. The AI narrative has not separated these outcomes. The supply vintage has.
The null hypothesis - no measurable AI impact on small-bay demand - is the most defensible position the current evidence supports. That is a statement about the evidence to date, not a forever conclusion — the developments that could change it are what we cover in Post 4 and in §7 of the full paper. We examine the structural channels through which AI does matter in the next posts: the physical constraints that keep small-bay infill outside the AS/RS automation story, the geographic concentration of AI-era GDP growth that makes Faropoint's markets structural beneficiaries, and the horizon risks worth monitoring.
The full econometric methodology - panel construction, Bartik instrument, and all robustness specifications - is documented in How will AI impact small-bay industrial properties? The report also covers Faropoint's four active underwriting levers derived from this analysis.
- CoStar Analytics. U.S. Industrial Size-Bin Time Series, 2007 Q1-2026 Q2; "US industrial vacancy rate forecast to peak in 2026," February 2026.
- EastGroup Properties. Q1 2026 Earnings Conference Call, April 22, 2026.
- Faropoint Research. Econometric analysis of AI intensity and small-bay industrial vacancy — TWFE, DiD event study, and Bartik 2SLS specifications on 46-market panel, 2016 Q1-2025 Q4. Internal working paper, 2026.
- Felten, E., Raj, M., and Seamans, R. (2021). AI Occupational Exposure Index (AIOE).
- Rexford Industrial Realty. Q4 2025 Earnings Conference Call and Supplemental Operating Data.
- Terreno Realty Corporation. Q1 2026 Earnings Release, April 2026.
- Green Street Advisors. "Quick Take: STAG / LXP — Quiet Quarter for Non-Coastal REITs," April 29, 2026.
Latest Insights and Updates
.png)


.png)