
- AI concentrates growth where Faropoint operates.
The metros that will benefit most from AI-driven economic expansion are where Faropoint's infill assets sit: the New York metro area, Los Angeles, South Florida, Dallas/Fort Worth, Houston, Chicago, Philadelphia, and Atlanta. Our tenants serve those economies' physical-world needs. AI strengthens tenant demand in the local markets experiencing the strongest economic growth. - AI poses some serious risks to bulk warehousing, but Faropoint has no exposure to this product.
Fixed automated storage and retrieval systems ("AS/RS") require 36+ foot clear heights, high-capacity electrical service, and capital outlays of tens of millions of dollars; these physical and economic thresholds place the Faropoint infill universe (20,000-200,000 SF, 18-28 ft clear height) outside the automation-disruption story as currently understood. We outline in §7 the horizon risks that could eventually change this picture. - The forces driving industrial CRE economics today are cyclical and structural, not technological.
The elevated vacancy and muted rent growth that LPs see in headline industrial numbers is a post-pandemic supply-cycle story (mid-box and bulk overbuilding that kicked off in 2021-2022 and is now delivering into an already-softening bulk market). Small-bay infill vacancy has held at 3-5% nationally while the overall market drifts toward 8%. AI has contributed no measurable structural break in this data.
Executive Summary
We believe the "Faropoint Universe" (industrial properties from 20,000-200,000 SF in dense, urban areas that accommodate multiple tenants) is well-insulated from AI-driven demand disruption under our base case and, if anything, directionally supported by the macro-geographic forces AI is setting in motion.
This is not a complacent view. We have evaluated key AI-driven threats to our Universe: warehouse robotics, autonomous trucking, drone delivery, AI-accelerated business consolidation, and structural e-commerce channel shifts. We have read the primary research from Prologis,1 NAIOP,2 CBRE, JLL, Cushman & Wakefield, Green Street, CoStar, Oxford Economics, and the leading academic literature on AI's labor-market and macroeconomic effects.3,4 Our conclusion is that the null hypothesis (no measurable AI impact on small-bay demand) is the most defensible position the current evidence supports, with the directional tilt running toward AI being supportive rather than harmful. We also document, in §7, the specific developments that could change this assessment — and our framework for monitoring them.
The argument rests on two reinforcing pillars that we call the double insulation:
Tenant insulation (Pillar 1): Small-bay tenants (HVAC and mechanical contractors, plumbers and electricians, regional distributors, light manufacturers, last-mile e-commerce SMBs, food service supply) operate in the sectors Oxford Economics identifies as having the lowest AI exposure (construction, transport, and accommodation/catering).5 Near-term AI substitution risk for these businesses is limited. Their operations are physical-world, relationship-intensive, and spatially fixed in ways that make them more resilient to automation displacement than the professional-services and information-processing sectors where AI disruption is concentrated.
Metro insulation (Pillar 2): Faropoint's assets sit in metros that Oxford Economics forecasts as the primary beneficiaries of AI-driven GDP and income growth: New York metro, Los Angeles, South Florida, Dallas/Fort Worth, Houston, Chicago, Philadelphia, and Atlanta.5 As these economies grow, the demand for physical-world services (the trades, local distribution, last-mile delivery, food supply, light manufacturing) grows with them. AI amplifies the metro economies that fill the properties in Faropoint's buy box.
This paper presents the supporting evidence across six related points: (1) the current softness in industrial is a supply cycle, not an AI shock; (2) the small-bay segment is physically and economically outside the AS/RS automation disruption story; (3) supply scarcity is a structural condition, not a cycle-specific anomaly; (4) Faropoint's market selection aligns with AI-winner geographies; (5) real-time REIT, lease, and econometric data corroborate the thesis; and (6) the horizon risks worth monitoring — and what we would need to see to update this house view.
Looking for an AI Shock That Hasn't Come
The chart below answers a simple question: if AI were disrupting demand for industrial real estate in a structurally meaningful way, we would expect to see a break in vacancy trends correlating with one or more of the AI milestones annotated — particularly the mass-awareness event of ChatGPT's November 2022 launch.

Source: CoStar Analytics, U.S. industrial size-bin time series, national aggregate, 2007 Q1-2026 Q2.
We do not see that break. What we see instead:
- Small-bay (sub-100K SF) tracked an entirely separate vacancy regime, holding in the 3-5% range through the full cycle. The COVID demand surge compressed small-bay vacancy modestly; the post-2022 supply cycle barely registered.
- Bulk (200K+) experienced a powerful V-shaped recovery from its own pandemic-era softness, then an equally powerful reversal as speculative bulk supply delivered at scale in 2023-2025. The post-ChatGPT vacancy rise in bulk product is timed to lease expirations from 2021-2022 commitments and to the freight recession that began in mid-2022 — not to AI deployment.
- No structural break coincides with any AI milestone. The Transformer paper (2017), GPT-3 (2020), ChatGPT (2022), and GPT-4 (2023) all passed through the industrial vacancy data without visible trace.
This is the null finding. AI, at this stage of deployment, has left no fingerprint detectable in current data on industrial demand at any size cohort.

Source: CoStar Analytics, national aggregate, same series as Figure 1.
Figure 2 pairs the spread with its cause. Bulk construction starts peaked in 2021-2022. These were driven by the pandemic-era's e-commerce boom (and the associated explosion in expected demand for bulk distribution space). The resulting delivery wave started hitting the market in 2023-2025 and is now in its final stages. The spread between bulk and small-bay vacancy widened because bulk supply arrived at scale; small-bay vacancy barely moved because almost nothing new was built there. The ChatGPT launch (dashed line) is coincident with the construction starts peak, but the causal arrow runs from speculative construction decisions to delivered supply to vacancy, not from AI deployment to demand destruction.
We ran the numbers. The answer, to date, is clear: there is no discernible empirical evidence of AI impacting industrial demand. To corroborate this visual evidence formally, Faropoint Research estimated three econometric specifications on a panel of 46 markets and 40 quarters (2016 Q1-2025 Q4), classifying markets by their 2018 AI-sector employment share (a predetermined, pre-treatment measure of economic AI intensity).7 The three specifications are a two-way fixed effects (TWFE) panel model, a difference-in-differences event study centered on the November 2022 ChatGPT launch, and a Bartik shift-share instrumental variables estimate.
Across all three, the same picture emerges: we cannot detect any statistically significant effect of AI on industrial vacancy, in either direction, in the small-bay segment. The TWFE point estimate for AI exposure on small-bay vacancy is directionally negative (higher-AI markets trend slightly tighter), but this finding falls well short of statistical significance. This null result confirms that AI disruption of small-bay industrial demand, if it exists at all, is not yet large enough to observe in three years of post-ChatGPT macroeconomic and real estate market data.
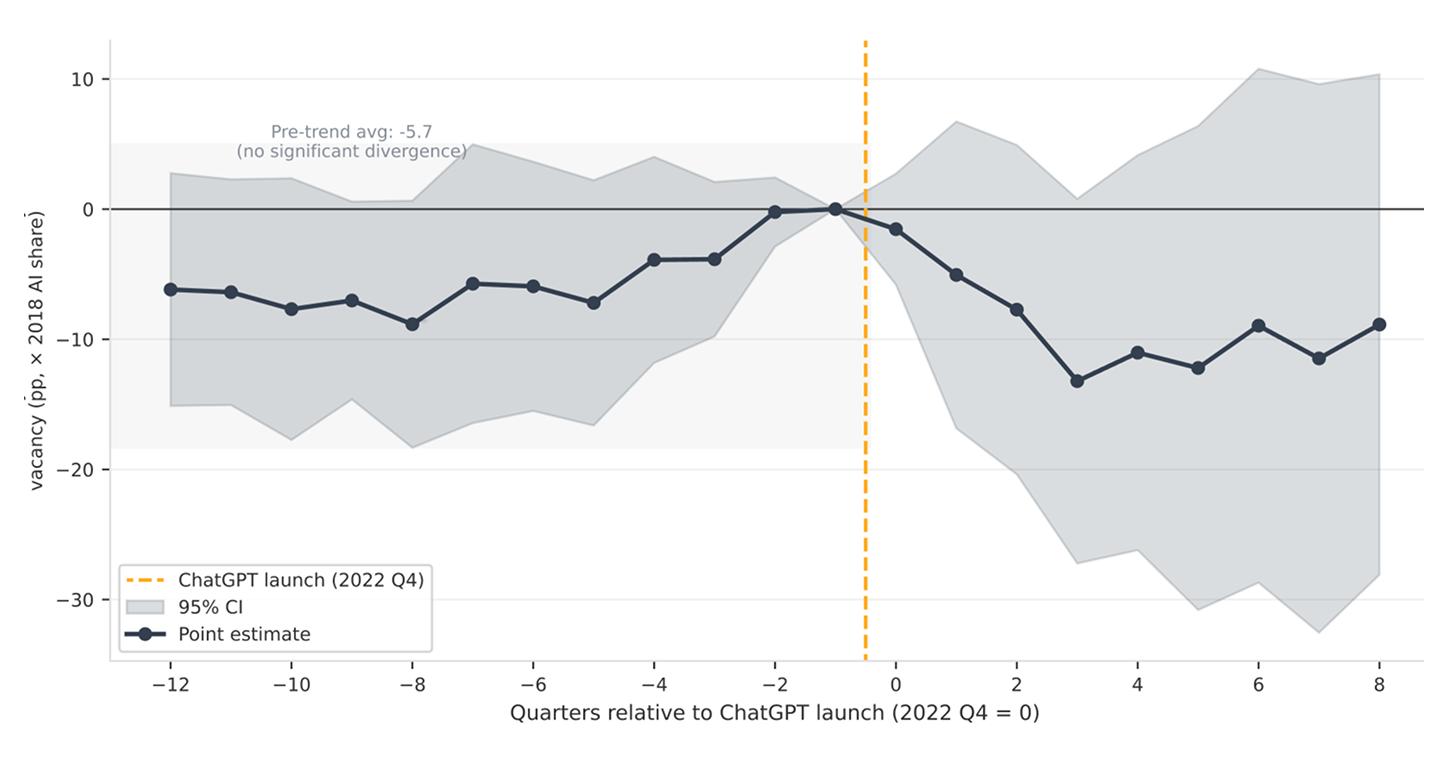
Source: Faropoint Research (2026), econometric analysis on CoStar market data merged with Oxford Economics quarterly employment panel, 46 markets.
This is unsurprising. Deployment of AI en masse is still in its early stages. Technology adoption curves, lease contract durations, and the time required for AI's macro-geographic growth effects to compound into new physical-world service demand all point to 2026-2030 as the window when effects, if any, would start becoming measurable. We are running the test now to establish the baseline and will continue monitoring the trend.
The one finding that is robust and directly actionable is the GDP channel. Across every specification and every model run, metro annual real GDP growth tightens small-bay vacancy with a coefficient of β = −0.106 (t = −4.0, p < 0.001, N = 1,840 market-quarters). Each 1 percentage point of annual real GDP growth in a market is associated with approximately 10 basis points of small-bay vacancy tightening, controlling for market fixed effects and nationwide time cycles. This is the strongest and most precisely estimated finding from any of our econometric tests, and the empirical grounding for the second pillar of our double-insulation thesis: Oxford Economics expects AI to concentrate GDP growth in the major-metro professional-services economies where Faropoint operates, and the GDP-to-vacancy relationship is now established at scale.
We will re-estimate this panel as new data accumulates. If a measurable AI disruption effect emerges in small-bay vacancy we will update this house view accordingly. To date, it has not.
What Is Actually Driving Industrial CRE Today
The headlines on industrial real estate are, on their face, unexciting: vacancy at a multi-year high, rent growth near 13-year lows, demand-supply balance not expected to fully clear until 2027. For investors who came into the sector on the strength of the 2020-2022 super-cycle, this feels like a hangover.
But the story is not AI. It is supply.
The overbuilding and its aftermath. Industrial construction starts peaked in 2022 at more than 500 million SF annually, nearly twice the 2017-2019 average. That wave of speculative supply began delivering in 2023 and will continue delivering through 2026. CoStar's February 2026 analysis placed national industrial vacancy at 7.5% entering 2026 and expected it to peak near 7.8-8.0% before a gradual descent.9 The April 2026 update pushed the demand-supply inflection point to early 2027 and revised average rent growth down to 1.6% for 2026-2027.10 These are supply-cycle consequences.
The size-segment story. CoStar's February 2026 analysis is precise about where the drag lives: properties in the 100,000-500,000 SF band are seeing availability rates above 10%, driven by sluggish real personal goods spending since H2 2025.9 Sublease space is rising in newer mid-box properties as tenants right-size. Green Street's March 2026 I.CON West findings are consistent: net absorption was negative in 2025 for buildings built before 2020 and positive for buildings completed in the past five years.11 The 300,000-400,000 SF segment in the Inland Empire alone has 40+ vacant availabilities at that size. That is the story.
Small bay's different regime. Sub-100,000 SF infill vacancy sits at 3-5% nationally — roughly half the overall market rate. EastGroup Properties' CEO was explicit on the Q1 2026 earnings call: "Vacancy out there in industrial is in the bigger box on the edge of town, not the infill shallow bay."12 This is not a framing choice; it is a description of the actual data.
Construction starts have collapsed. 2025 starts fell to 263 million SF — a 10-year low, roughly half the 2022 peak. ULI/PwC projects 2026 deliveries at 70% below the pandemic peak.13 This sets the table for a vacancy inflection and a return to rent growth, with small-bay leading the recovery given its structural undersupply condition.

Source: CoStar Analytics, national industrial size-bin time series, annual aggregates.
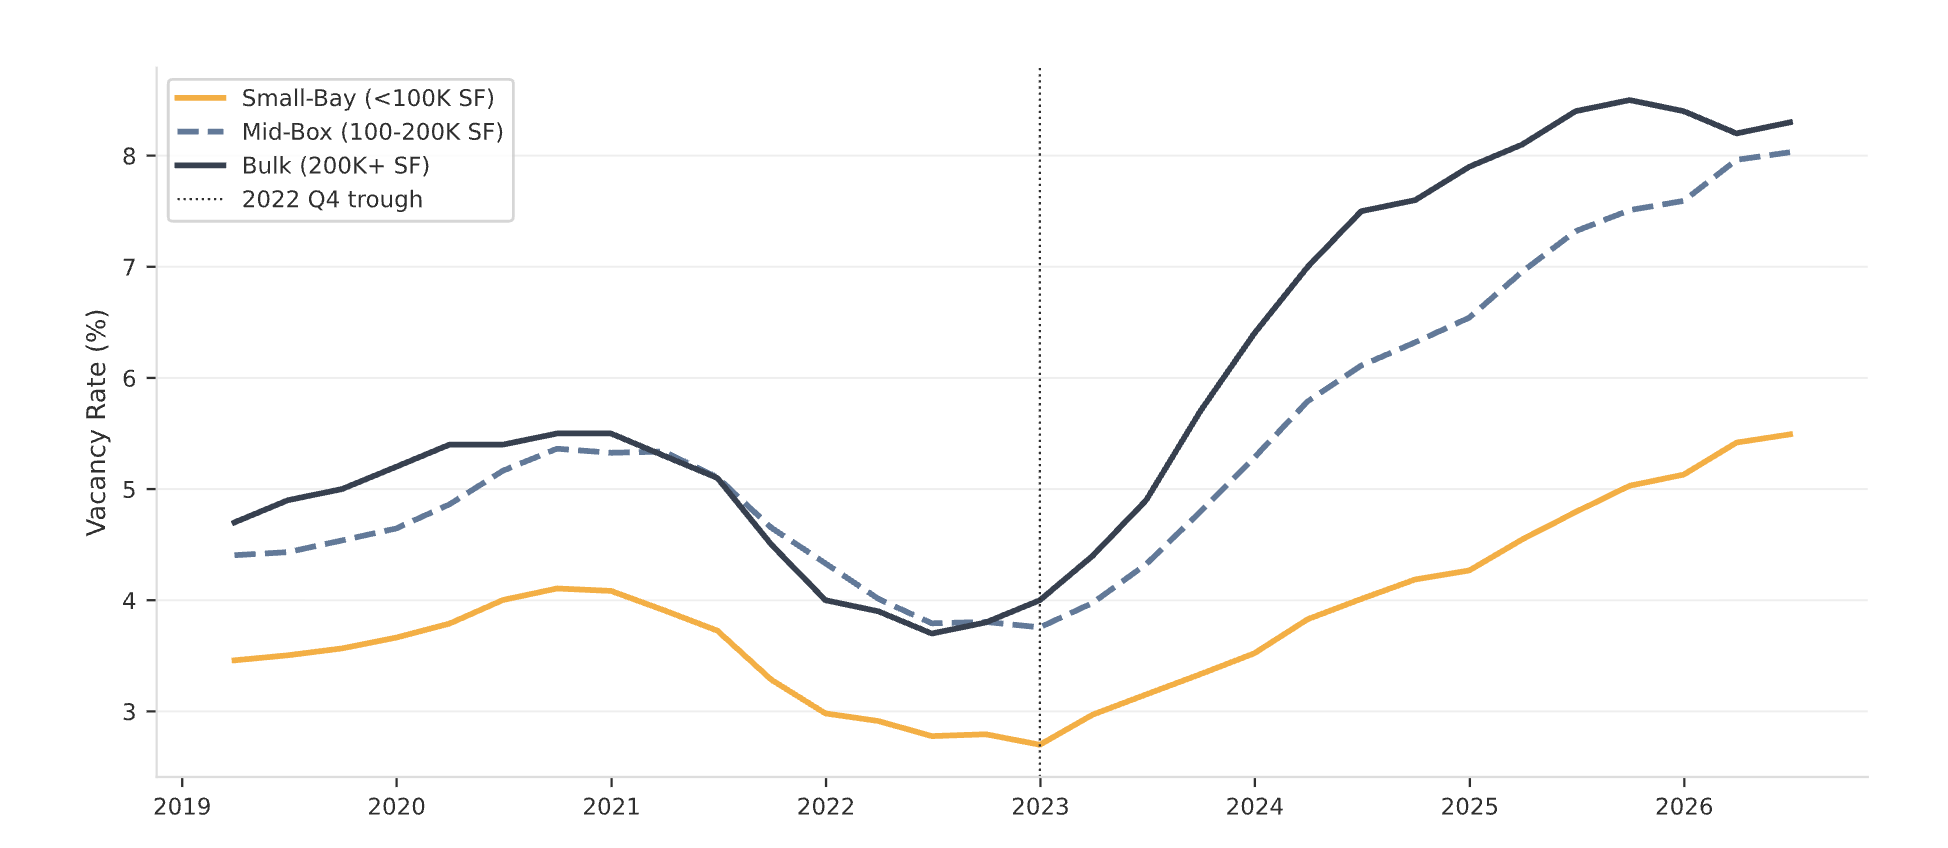
Source: CoStar Analytics, national aggregate.
The macro headwinds are real but manageable: trade policy volatility from renewed tariff uncertainty, subdued consumer goods spending since H2 2025, and continued freight sector rebalancing. These are cyclical factors, not secular ones. The structural setup (lean pipeline, supply-constrained small-bay, AI-amplified metro demand) is increasingly favorable as the delivery wave subsides.
The Supply Constraint: Small-Bay's Durable Moat
Supply constraint is the most important component of Faropoint's investment thesis. If anything, AI's potential impact has served to increase our conviction in long-term constrained supply.
Over the past decade, 115 million SF of sub-50,000 SF industrial space has been lost to conversion across the United States — torn down and replaced with higher-density residential, mixed-use, or retail uses.14 Over the same period, new construction of sub-100,000 SF product has been negligible: only approximately 90 million SF is currently under construction nationally, representing 0.5% of existing stock. For context, the overall industrial market has a ~3% construction pipeline.14
The economics of new small-bay construction are prohibitive. Construction costs are up 44% since 2019. Replacement-cost rents are approximately 20% above current Class A market rents in most major markets, meaning speculative development does not pencil. Land scarcity in infill locations (the Meadowlands, Long Island, coastal Los Angeles, Miami-Dade) is structural. You cannot build where you cannot find land at a basis that underwrites.
The investment market has taken notice. Sub-150,000 SF properties represented 62% of 2024 industrial transaction volume by deal count.15 Institutional buyer share of the sub-150K market grew from 16% to 20% of deals in 2024.15 Lee & Associates documents 40%+ rent growth since 2020 for small-bay product and average sale prices up 55% to $104 per SF.16 The capital is rotating toward the segment with the most durable supply constraint.


Source: CoStar Analytics, 2026 Q1.
Green Street's I.CON West analysis captures what happens when scarcity meets institutional quality: SoCal industrial values are down 35%+ from their late-2022 peak, but those same panelists are broadly bullish long-term, citing supply barriers, port infrastructure, and population base as irreplaceable location attributes.11 The distinction between current pricing and structural value is exactly where Faropoint's infill thesis operates.
Why Small-Bay Is Structurally Excluded From AS/RS Disruption
The central fear in the AI-industrial-displacement narrative is the following: automated storage and retrieval systems (AS/RS) can reduce warehouse footprints by 60-75%, releasing massive amounts of industrial demand. If true broadly, it would be a severe headwind for the asset class.
While this is a real risk, it threatens a product type outside Faropoint's buy box.
The clear-height threshold. The most economically effective AS/RS technologies (e.g., AutoStore cube-storage grids, Exotec Skypod, Swisslog systems) require ceiling heights of 36-46 feet to achieve their advertised density gains.17,18 Swisslog, as an AutoStore integration partner, advises: "For warehouses with ceiling heights below about 13 meters [~40 feet], AutoStore offers the highest storage density of any goods-to-person AS/RS." Exotec's Skypod reaches 46 feet. Green Street's March 2026 I.CON West notes identify 36 feet clear as the lower bound of automation compatibility for bulk tenants, with 42 feet now the spec standard for new speculative bulk construction over 500,000 SF.19
Small-bay infill product typically presents 18-28 feet of clear height. This is physically incompatible with the AS/RS automation that is reshaping bulk warehouse economics. Adding AS/RS in a 24-foot-clear building simply doesn't pencil.
The floor-flatness constraint. Automated guided vehicles ("AGV") and autonomous mobile robots ("AMR") floor systems need very flat (FF50/FL35) to superflat (FF100/FL50) ratings. Typical existing slabs in infill industrial product fall short (moderately flat, or FF25/FL20). CBRE Investment Management has documented that retrofitting existing floors to AGV-grade is "likely impossible" in most cases; the capital outlay would dwarf any automation benefit.20
The cost-stack reality. Even if the physical constraints were manageable, the economics preclude AS/RS for small-bay tenants. Mid-market shuttle and cube systems run $2-6 million; full enterprise AS/RS programs range from $8 million to $40 million+. For a tenant occupying a 50,000 SF small-bay space at approximately $15/SF (paying ~$750,000 in annual rent), a $5 million automation investment represents 6.7 times annual rent. AS/RS is a transformative investment for the economics of a 500,000+ SF national distribution center, but completely irrelevant to a local plumbing supply distributor in a 40,000 SF Long Island unit.
The tenant-universe reality. Most of Faropoint's target tenants (think HVAC contractors, plumbers, electricians, regional specialty distributors, light manufacturers, last-mile e-commerce SMBs, food service supply companies) don't operate typical high-throughput warehouses. They operate shops, staging yards, light assembly spaces, and distribution facilities. Their throughput volumes and SKU complexity are far short of making AS/RS economically relevant. These are businesses whose primary competitive assets are technician availability, route density, and local relationships; their success has very little to do with warehouse throughput.
What automation does penetrate small bay: RaaS, and it preserves occupancy. The one automation pathway genuinely reaching smaller industrial operators is the Robots-as-a-Service (RaaS) model. Formic Technologies, the largest independent U.S. robot fleet operator with 130+ factories under contract, offers end-of-line packaging automation (box filling, pallet loading) on a subscription basis, removing the capital barrier.21 Critically, Formic's robots work inside existing factory footprints — the manufacturer does not need less space because of the robots; they need the same space with higher throughput. Locus Robotics' 2025 Locus Array, a 10-foot-height-profile AMR compatible with standard racking, delivers 2-3x picking productivity inside unmodified warehouses.22 These are tools that make small-bay tenants more competitive, more profitable, and more likely to renew and expand.

Source: Green Street I.CON West notes (March 2026); vendor specifications from AutoStore, Exotec, and Swisslog.
The automation story for industrial is real: but its disruption is a story about bulk and mid-box product with 36+ foot clear heights, not a story about the supply-constrained infill segment.
Faropoint's Markets Are AI Winners
The most consequential framing for this white paper may be the one that flips the AI narrative entirely: on Oxford Economics' base case, AI is a tailwind to Faropoint's markets, not a threat to the economies that populate our buildings.
Oxford Economics' April 2026 research briefing, "AI will deepen regional inequality," provides the macro-geographic architecture for this argument:5
- Major cities with large professional-services sectors (finance, technology, consulting, information services) are best positioned to leverage AI. They have the frontier firms, the skilled labor force, and the sectoral diversity to create new jobs alongside AI adoption rather than simply substituting for existing ones.
- The five U.S. metros that drove roughly half of all U.S. GDP and employment growth from 2005 to 2019 (New York, San Francisco, San Jose, Los Angeles, and Seattle) are projected to continue leading growth on the same 2025-2030 forecast horizon.
- Texas metros (Dallas and Houston) are also well-positioned. Their diverse, service-driven economies will amplify GDP and income growth as AI adoption deepens in their professional-services and technology sectors.
- Industrial hubs and rural areas (where dominant sectors like manufacturing, agriculture, and distribution have the lowest AI exposure) will see fewer direct AI gains. However, this also means fewer direct AI job losses.

Source: Oxford Economics, U.S. MSA Annual GDP Forecast, March 2026 vintage.
This creates Faropoint's double insulation in concrete geographic terms.
The tenants in our buildings operate in NAICS 23 (Construction), 48-49 (Transportation and Warehousing), and 31-33 (Manufacturing). These are sectors Oxford Economics scores as having the lowest GenAI productivity benefit and therefore the lowest displacement risk.5 Our typical contractor tenant, regional distributor, or light manufacturer faces limited near-term AI substitution risk. Their skills are physical, local, and relationship-intensive in ways that make algorithmic replacement substantially harder than in desk-bound knowledge-worker roles.

Source: Oxford Economics, "AI will deepen regional inequality," April 28, 2026.
The metro economies hosting our buildings are, by Oxford's framework, the primary AI winners. As New York's financial sector, Los Angeles's technology and media industries, and Boston's life-sciences and technology ecosystem expand their GDP contribution — and as that income growth spills into household spending on physical-world services — the demand for trades contractors, local distribution, last-mile delivery, food supply, and light manufacturing grows with the metro economy. Our buildings are an infrastructure layer for the physical economy that AI-fueled metros generate.
One nuance Oxford Economics raises: if AI proves more labor-replacing than their base case projects, the gains would narrow to an even smaller group of actors, potentially hollowing out service economies in metros with shallower professional-services bases. In this scenario, however, the low-AI-exposure sectors that dominate small-bay tenant rosters would be relatively insulated — their jobs would remain when higher-exposure sectors contract. The bear case on the macro doesn't necessarily become a bear case for our tenants.
What Could Change This View - Horizon Risks for Small-Bay
The evidence presented in §§2-6 supports a net-positive outlook for small-bay industrial under current conditions. That does not mean the outlook is static. Below, we assess four categories of horizon risk that we monitor actively and that could, in combination or at scale, shift the supply-demand dynamics for the infill segment. Our current read is that these risks are real but manageable — most of them are either unlikely to arrive at meaningful scale within the next five years or are directionally positive for small-bay even under adverse scenarios. The qualitative matrix in Figure 11 summarizes our placement of each risk.
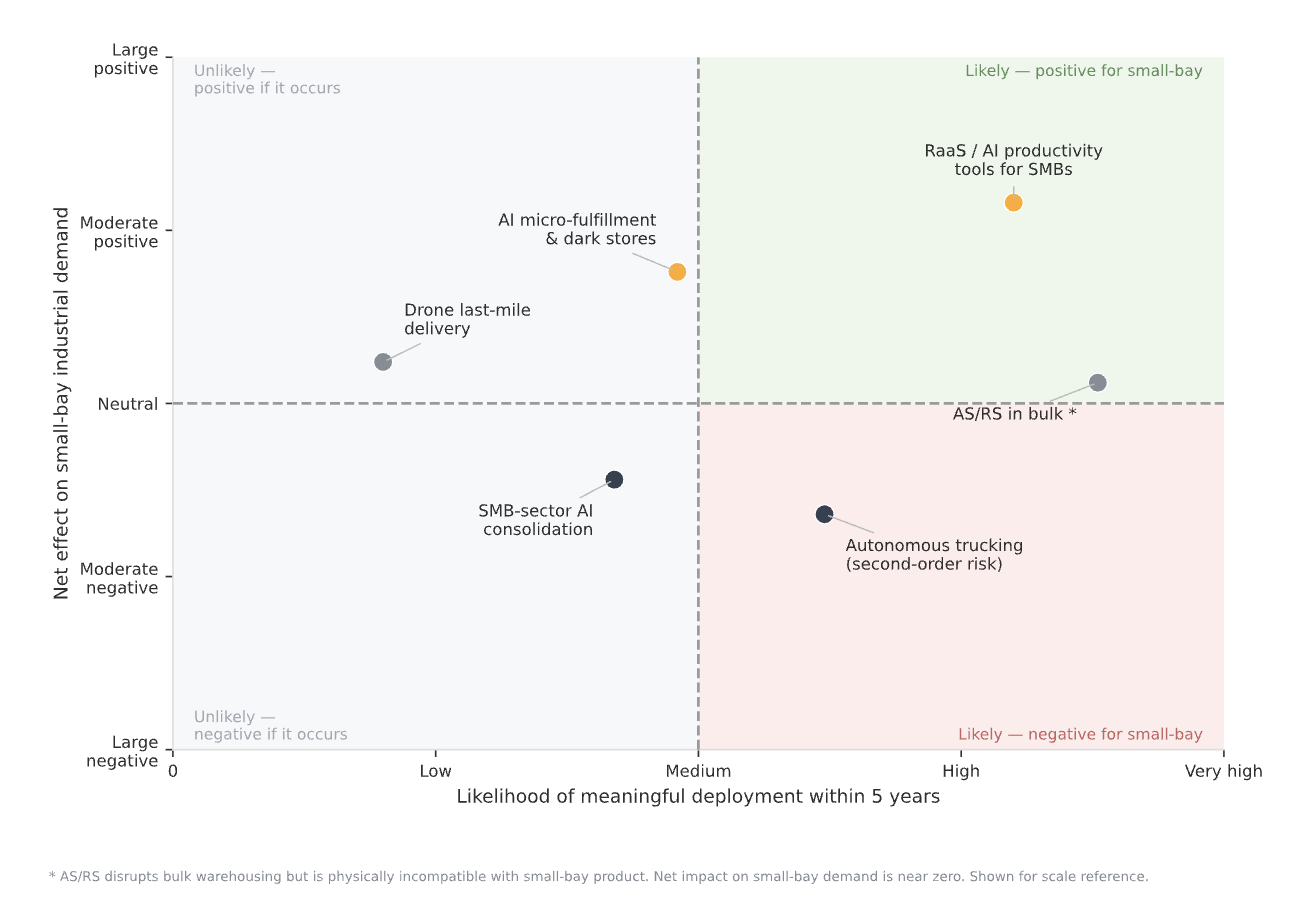
Source: Faropoint Research qualitative assessment, May 2026.
Autonomous Trucking
The commercial launch of autonomous vehicles (AVs) on long-haul freight corridors is now real. Aurora Innovation began driverless commercial operations in Texas in April 2025, with Kodiak Robotics and Gatik continuing to expand middle-mile routes for Walmart, Loblaws, and other large shippers.27 The economic prize is the driver-hour cost on Interstate corridors — a compelling value proposition for high-volume, terminal-to-terminal, long-haul freight.
The differential impact on small-bay vs. bulk is significant. Bulk mega-DCs positioned near Interstate interchange terminals are the primary nodes in the AV value chain; they are both potential beneficiaries (lower inbound freight cost, wider sourcing radius) and, in some scenarios, consolidation targets (fewer but larger nodes if AV economics tilt toward hub-and-spoke). Small-bay infill product, by contrast, sits downstream of those terminals on shorter, urban, multi-stop, human-relationship-intensive routes — the last-mile and final-100-meters segments where the AV value proposition is weakest and regulatory barriers remain highest.27 The more immediate risk for small-bay is indirect: if AV economics drive shipper consolidation toward fewer, larger regional DCs, some local distributors who are today's small-bay tenants could be absorbed into larger operators or rendered redundant. We watch for this dynamic in SMB distributor churn and lease-renewal behavior, but we have seen no instances of this in our operations to date.
SMB Tenants in the AI Era
The AI era will introduce chaos that forces changes in our tenant base's business plans and will change the economics of their operations, but sectorally we view the sum total of these changes to be net positive on overall space demand. That said, there are some clear risks we track as AI-driven transformation begins in the SMB space. On the opportunity side, AI-powered productivity tools (RaaS for manufacturing automation, AI dispatch and routing for contractors, AI procurement platforms for distributors) are actively diffusing through the SMB economy. The RaaS story in §5 applies here: these tools make the median small-bay tenant more efficient, more competitive, and more likely to grow into additional space rather than consolidate out of it. McKinsey's 2024 SMB AI-adoption survey found AI tool adoption accelerating fastest in small businesses with 10-100 employees; this is largely the tenant group that fills small-bay rent rolls today.28
On the risk side, AI enables the rollup economics that have historically required large private-equity platforms. AI-driven customer matching, automated operations, and centralized back-office functions make it cheaper to acquire, integrate, and standardize small regional businesses in fragmented service sectors (HVAC, plumbing, electrical, auto-aftermarket).28 If AI-fueled consolidation accelerates significantly, the market could eventually see fewer, larger tenants per market — with larger space requirements and more negotiating power on lease terms. This is a risk we quantify explicitly at the portfolio level via tenant sector and size concentration monitoring, but the pace of consolidation needed to move aggregate small-bay demand meaningfully is still substantially above what we observe in current transaction and formation-rate data.
Ecommerce Trajectory
Ecommerce penetration, which peaked at roughly 22% of U.S. retail sales in Q2 2020 before settling near 16% in 2022-2025, is broadly expected to resume its structural upward trajectory as AI personalizes the shopping experience and reduces purchase friction.29 The direction of this trend for industrial real estate depends heavily on which ecommerce model wins. The micro-fulfillment and dark-store model — where dense, local fulfillment nodes (often in small-bay or converted retail spaces) serve same-day delivery demand — would be a direct small-bay tailwind. Operators like Gorillas, GoPuff, and Amazon's dark-store expansion have, at various points, been active users of sub-50,000 SF urban industrial product.
The countervailing force is AI-driven inventory optimization: if national retailers and 3PLs can run their networks with less total physical inventory (via better demand forecasting and postponement strategies), the aggregate industrial demand per dollar of retail sales could drift lower. This would be a mild headwind across all industrial size cohorts, not specific to small-bay. A third dynamic worth watching is AI agent-driven purchasing: if AI agents begin making routine household and business purchases autonomously, the channel mix (B2B wholesale vs. B2C retail vs. direct-from-manufacturer) could shift in ways that are difficult to forecast but would likely increase the value of last-mile fulfillment proximity — which favors small-bay infill over distant mega-DC supply chains.
Other Watch-Items
Drone last-mile delivery. Regulatory progress on urban beyond-visual-line-of-sight (BVLOS) drone delivery has been slow; the FAA's Part 135 framework covers limited operations and a handful of approved operators (Wing, Zipline, Amazon Prime Air) in low-density areas.30 Full urban drone-delivery scale is, in our assessment, a post-2030 story at earliest. If and when it arrives, the logistics infrastructure it requires (drone hub landing pads, high-density pick-and-pack facilities, battery charging infrastructure) maps closer to small-bay infill product than to bulk mega-DC footprints — making this a potential tailwind rather than a threat.
Bulk-to-data-center conversion. AI computing demand has triggered a significant reallocation of capital toward data center construction, and some obsolete bulk industrial properties in power-rich markets are being repositioned as data center sites. To the extent this trend accelerates, it removes bulk industrial supply from the market, relieving the oversupply pressure that has been the primary headwind for headline industrial vacancy. For small-bay, this is indirectly positive: fewer competing bulk availabilities improves the relative attractiveness of infill product for tenants who can use either.
Tariff-driven re-shoring and near-shoring. The 2025-2026 tariff environment has accelerated domestic manufacturing investment in sectors including semiconductors, EV battery components, and industrial equipment. The primary beneficiaries in industrial real estate are mid-box and large manufacturing facilities in the Midwest, Southeast, and Texas. Small-bay infill benefits as a second-order effect via the supplier and service-business networks these facilities generate. We note that re-shoring and near-shoring trends are highly sensitive to trade policy and could reverse; we do not embed tariff tailwinds in our base-case underwriting.
Operating Data Corroborates the Thesis in Real Time
The divergence between infill small-bay and bulk/non-coastal industrial is showing up in REIT earnings.
Infill-focused REITs:
- Rexford Industrial (Q4 2025): 96.4% same-property occupancy; 13% cash leasing spreads year-to-date; management cited "structural barriers" limiting new supply as the primary demand driver.23
- Terreno Realty (Q1 2026): 22.4% cash rent change on new leases; 38% of portfolio in submarkets with shrinking industrial supply, 42% in submarkets with no net new supply.24
- EastGroup Properties (Q1 2026): Sub-4% vacancy for its ≤200,000 SF portfolio; CEO commentary explicitly drawing the distinction between big-box periphery weakness and infill resilience.12
Bulk/non-coastal REITs (Green Street Quick Take, April 29, 2026):25
- STAG Industrial (Q1 2026): 97.0% occupancy (down ~70 bps sequentially, 60 bps year-over-year); 4.1% cash SP-NOI growth; guidance reaffirmed but occupancy trending softer.
- LXP Industrial Trust (Q1 2026): 96.6% occupancy (down 50 bps sequentially); 2.0% cash SP-NOI growth; 14% cash releasing spreads (vs. Terreno's 22.4%).
Both segments remain healthy, but there is a clear difference in the direction of travel: infill small-bay operators are posting accelerating releasing spreads and stable occupancy, while non-coastal bulk operators are seeing occupancy erode modestly from high bases. Green Street's Industrial Sector Surprise Score for Q1 2026 remained at "+1" (slightly positive versus expectations), with positive surprises concentrated in infill product.25
Underwriting Implications
The evidence across these arguments is reflected in four active dimensions of Faropoint's underwriting framework.
1. Submarket selection calibrated to automation-compatibility thresholds
The Green Street 36-foot clear-height threshold for automation compatibility is a standing acquisition filter in Faropoint's underwriting process.11,19 In markets with active new speculative supply (Inland Empire East, parts of Dallas, Atlanta), acquiring sub-28-ft clear buildings adjacent to new Class A supply at 42+ ft carries a flight-to-quality risk flag in 5-year IRR scenarios. In supply-constrained infill markets (Meadowlands, Long Island, coastal Miami-Dade, Northern NJ) an 18-foot-clear building where nothing new will be built retains location value that supersedes competing speculative supply. Faropoint underwrites the third-best building in a supply-constrained submarket over the best building in a submarket with active new supply competition.
2. Metro allocation grounded in the GDP-vacancy empirical relationship
Faropoint's metro-selection discipline is calibrated to the GDP-vacancy elasticity estimated in our own panel data: each 1 percentage point of incremental annual real GDP growth in a metro is associated with approximately 10 basis points of small-bay vacancy tightening, controlling for market-level fixed effects and national time cycles (β = −0.106, t = −4.0).8 Faropoint's existing concentrations in the New York metro, Los Angeles, South Florida, Dallas/Fort Worth, Houston, Chicago, Philadelphia, and Atlanta align precisely with the metros Oxford Economics forecasts as the primary beneficiaries of AI-driven GDP growth through 2030.5 New market entry is evaluated through this lens: the underwriting question is not only "what is the market's vacancy today?" but "what is this market's GDP growth trajectory, and what does the β imply for small-bay vacancy over the hold period?"
3. Multi-tenant diversification as an explicit AI hedge
Faropoint's portfolio construction targets 5-15 tenant multi-tenant assets specifically because the AS/RS, drone, AV, and AI-consolidation risks each affect a different subset of tenants.26 A 40-unit multi-tenant small-bay property spanning trade contractors, regional distributors, light manufacturers, and e-commerce SMBs is structurally hedged: no single automation wave disrupts the entire rent roll simultaneously. This diversification benefit is quantified and presented explicitly in LP reporting.
4. Redevelopment optionality pricing in aged-stock infill markets
In markets like Long Island and the Meadowlands, average building age exceeds 50 years and average clear heights are consistently below 28 feet. Faropoint's underwriting in these markets therefore often consider redevelopment scenarios alongside the stabilized cash-flow scenario; these frequently include roof-raising, power upgrades, or adaptive reuse options. JLL describes Long Island as "the tightest market in the Northeast" despite aged stock. The current SoCal 35%+ pricing dislocation from the late-2022 peak creates the entry window for this optionality in markets that were previously too expensive to underwrite a redevelopment path.11
- Prologis Research (2025). "Applied Automation in the Warehouse Boosts Value Across Stakeholders." October 2025.
- NAIOP Research Foundation (2025). "From Static to Strategic: AI's Role in Next-Generation Industrial Real Estate." October 2025.
- Acemoglu, D. (2024). "The Simple Macroeconomics of AI." NBER Working Paper 32487.
- Brynjolfsson, E., Li, D., and Raymond, L.R. (2025). "Generative AI at Work." NBER Working Paper 31161.
- Oxford Economics (2026). "AI will deepen regional inequality." Research Briefing, April 28, 2026. Lead author: Liam Sides.
- CoStar Analytics. U.S. Industrial Size-Bin Time Series, 1990 Q1-2026 Q2. National aggregate, 10 size cohorts, 44 metrics per bin.
- Felten, E., Raj, M., and Seamans, R. (2021). AI Occupational Exposure Index (AIOE). GitHub: AIOE-Data/AIOE.
- Faropoint Research (2026). Econometric analysis of AI intensity and small-bay industrial vacancy: TWFE, DiD event study, and Bartik 2SLS specifications on 46-market panel, 2016 Q1-2025 Q4. Internal working paper.
- CoStar Analytics (2026). "US industrial vacancy rate forecast to peak in 2026." February 3, 2026.
- CoStar Analytics (2026). "US industrial demand expected to overtake new supply by early 2027." April 27, 2026.
- Green Street Advisors (2026). "Conference Insights — Industrial: Cautious Optimism (NAIOP I.CON West)." March 5, 2026.
- EastGroup Properties (2026). Q1 2026 Earnings Conference Call Transcript. April 22, 2026.
- ULI and PwC (2026). Emerging Trends in Real Estate: United States and Canada 2026. Urban Land Institute.
- PW Development (2025). "Small-Bay Industrial 2025 Trend Report: Micro-Flex Is Booming."
- Corebridge Financial (2025). "The Rising Star of the Industrial Sector — Light Industrial Outlook."
- Lee & Associates (2025). "Small Bays, Big Opportunity." Research Report, 2025.
- Swisslog AG (2024). "Four Questions to Determine if AutoStore Is Right for Your Operation." swisslog.com.
- Exotec SAS (2026). Skypod System Technical Specifications. exotec.com.
- Green Street Advisors (2026). I.CON West conference notes, March 2026. 36-ft clear-height automation compatibility threshold.
- CBRE Investment Management (2024). "The Case for Modern Logistics Facilities." cbreim.com.
- Green Street News (2026). "Robot-fleet operator developing issuance program (Formic Technologies)." February 13, 2026.
- Locus Robotics (2025). "Locus Array: Beginning of the Autonomous Warehouse Era." locusrobotics.com.
- Rexford Industrial Realty (2026). Q4 2025 Earnings Conference Call and Supplemental Operating Data. February 2026.
- Terreno Realty Corporation (2026). Q1 2026 Earnings Release. April 2026.
- Green Street Advisors (2026). "Quick Take: STAG / LXP — Quiet Quarter for Non-Coastal REITs." April 29, 2026.
- BKM Capital Partners (2026). "Q1 2026 White Paper: What Sets Small- and Mid-Bay Industrial Apart."
- Aurora Innovation (2025). Aurora Driver Commercial Launch: Driverless Trucking in Texas. April 2025. See also: Kodiak Robotics and Gatik press releases on commercial middle-mile partnerships with Walmart and other large shippers, 2024-2025.
- McKinsey & Company (2024). "AI adoption in small and medium-sized enterprises." McKinsey Global Survey on AI, 2024. See also: industry reporting on PE-backed rollup activity in HVAC, plumbing, and electrical service sectors, 2022-2025.
- U.S. Census Bureau, Quarterly E-Commerce Report (2025). E-commerce as % of total retail sales, Q1 2020-Q3 2025. census.gov/retail.
- Federal Aviation Administration (2025). Beyond Visual Line of Sight Aviation Rulemaking Committee; Part 135 Air Carrier Certification for Drone Operations. faa.gov. As of May 2026, FAA-approved BVLOS operators include Wing (Google/Alphabet), Zipline, and Amazon Prime Air in limited geographic corridors.
Latest Insights and Updates
.png)


.png)